Optimizing Production Monitoring with Grafana
Introduction
Many customers rely on Lineate’s 24/7 support team to monitor and support production systems. But when the servers you monitor are measured in the hundreds, it’s important to have a repeatable reporting stack. Our support engineers need to respond quickly to system issues and having robust dashboards with live metrics is incredibly useful for troubleshooting. But the challenge is that these metrics may be coming from many different systems -- sometimes even different cloud providers. Enter Grafana.
How It works
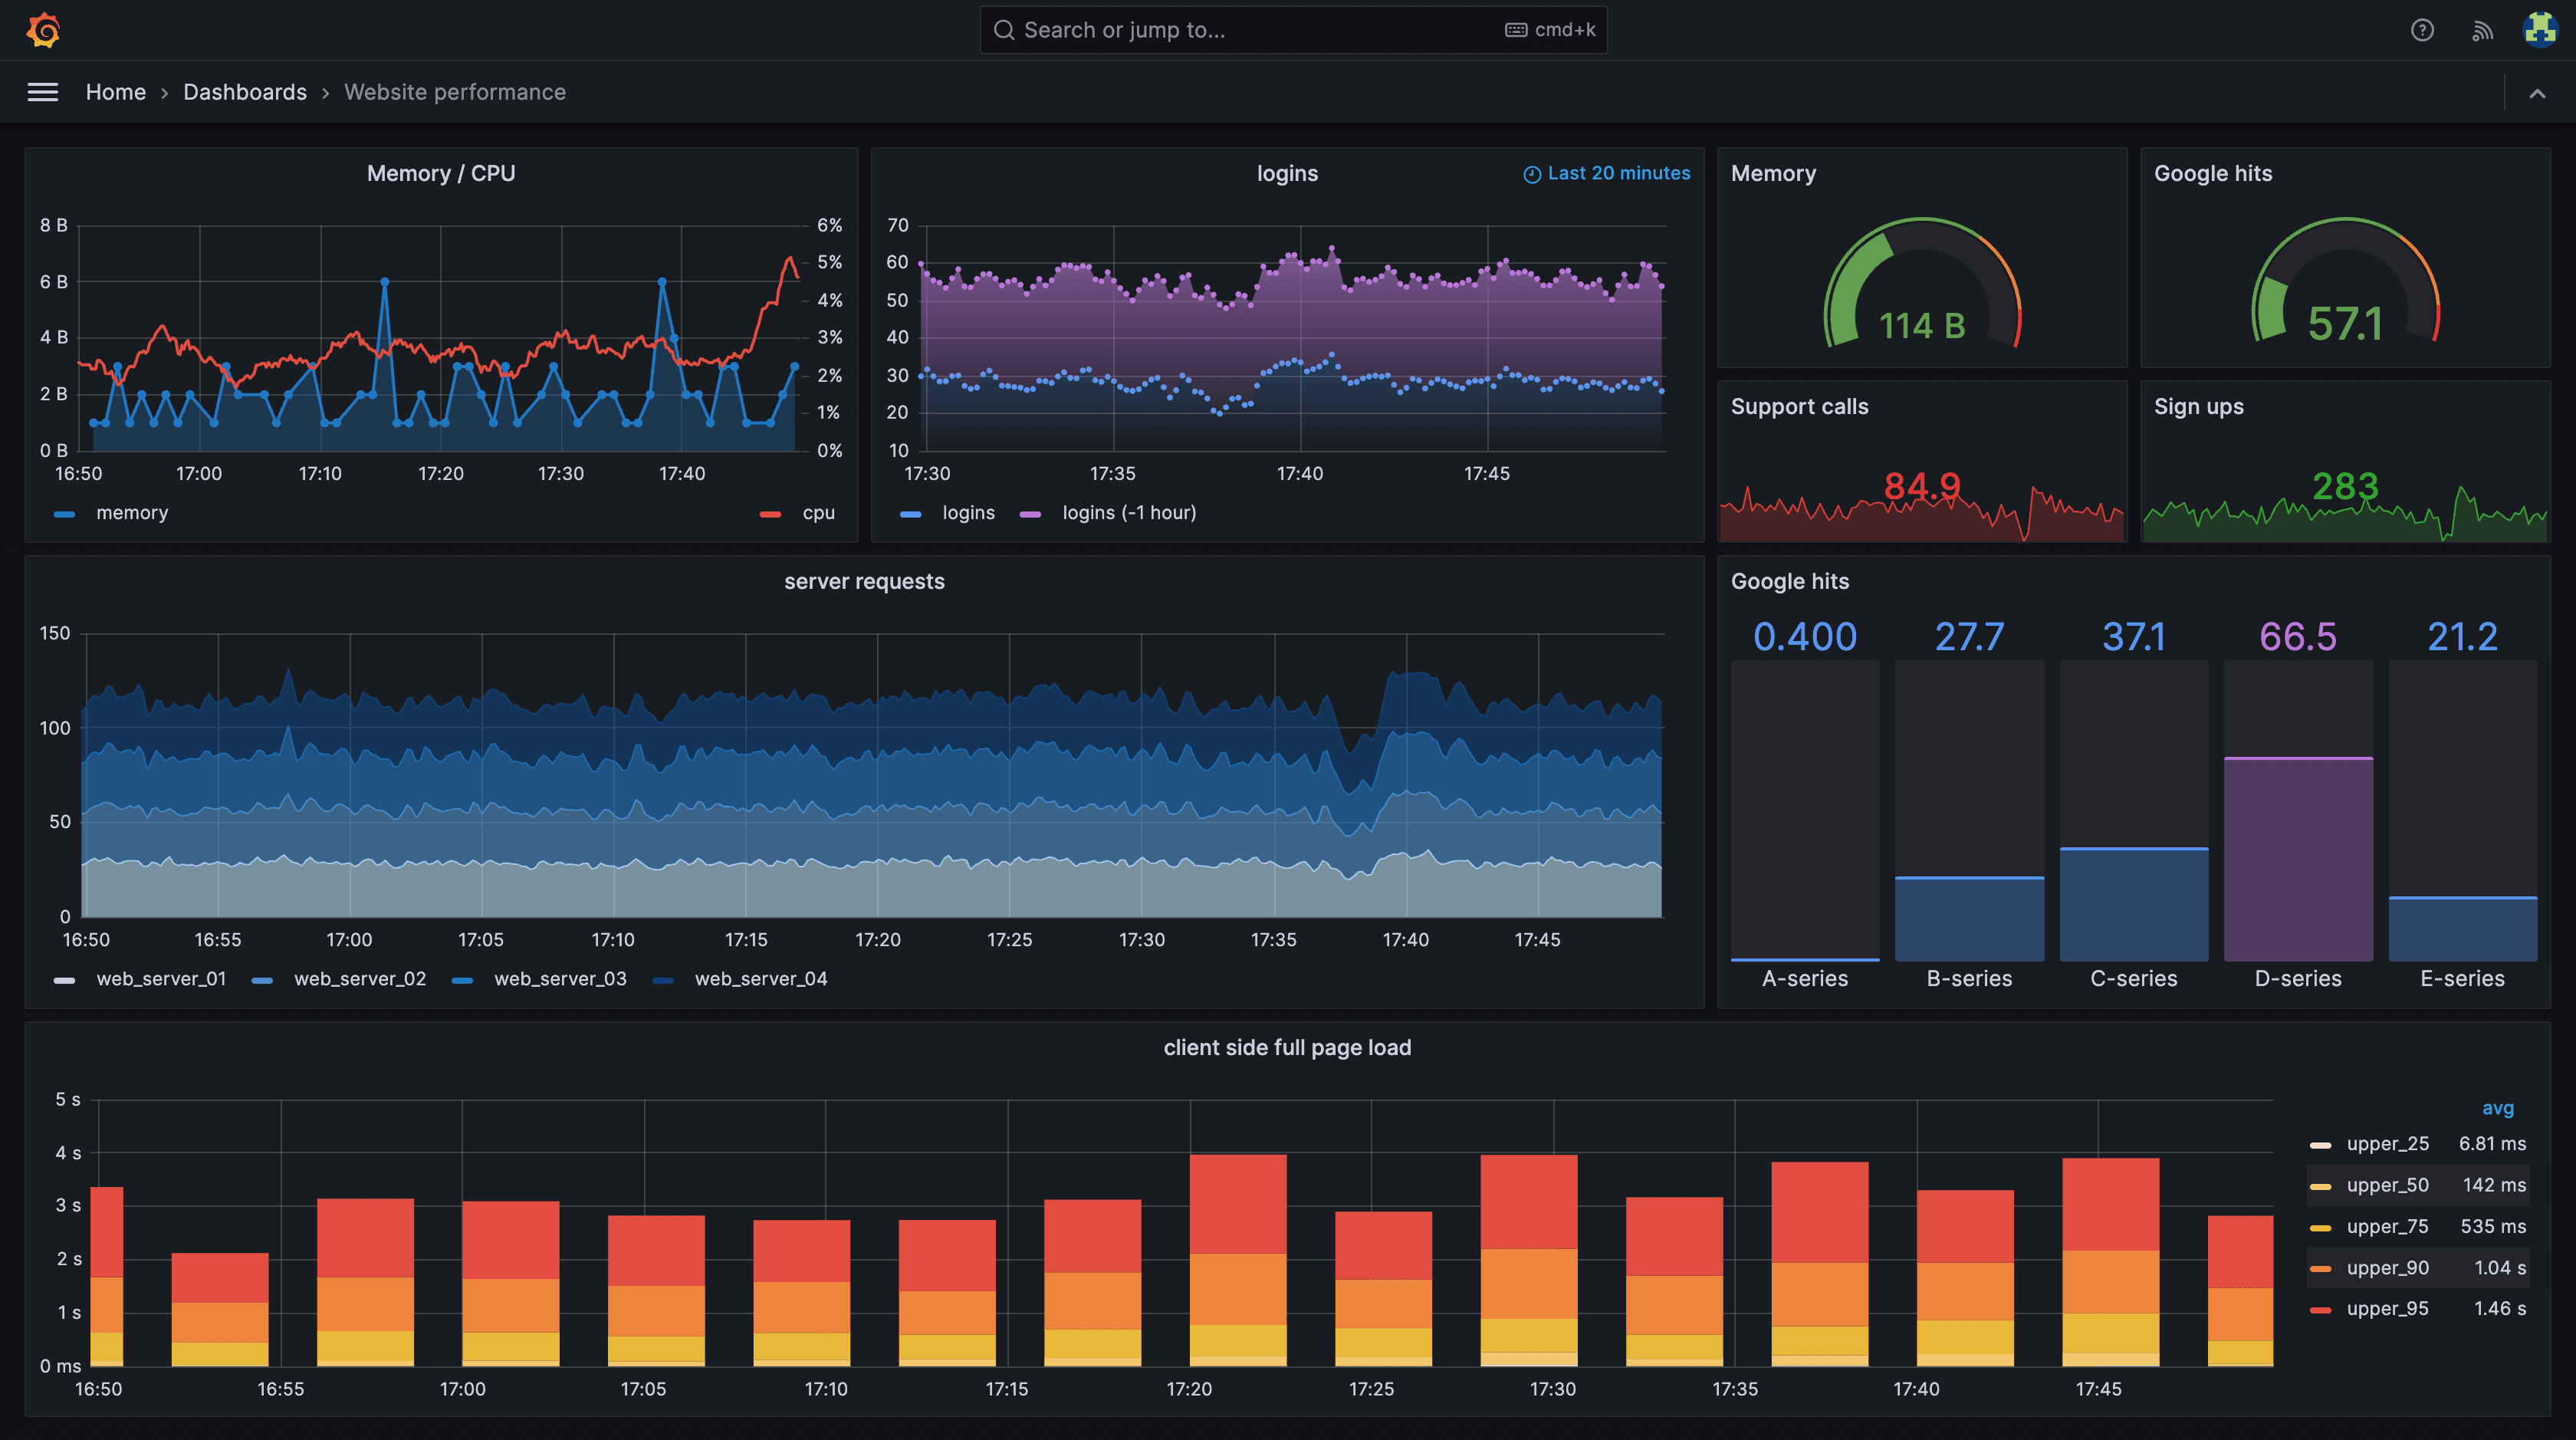
Grafana is an open-source visualization platform for creating informative dashboards from a wide variety of data sources. It really doesn’t matter where a database is or if you are using Kubernetes clusters instead of traditional virtual instances - those metrics can all be easily integrated into one dashboard. You can even pull in live metrics from ElasticSearch. And the Grafana Alerting system can inform you as soon as a metric crosses an unacceptable threshold.
Charts can be created in several ways depending on what’s most appropriate for the data: graphs, histograms, or heatmaps, for example. It’s no wonder why Grafana is a popular choice for creating visualizations. The open-source nature also allows for community involvement in development; new data sources are updated frequently.
Grafana vs. Cloud Provider Reporting Systems
Cloud providers do provide their own reporting systems. AWS CloudWatch, for example, can create dashboards (or use default ones) to monitor AWS services being used. This may be a good option if you have AWS-only workloads. However, Grafana gives you the ability to grow beyond one cloud provider and include business metrics that may not be available in your cloud account. Grafana is also easier to use than the cloud provider monitoring systems (especially in building visualizations).
AdTech Use Case
For one AdTech customer of Lineate we built Grafana dashboards to monitor hundreds of servers. Over time we added business metrics (measure different channel revenue and bidding errors, for example). These dashboards are now a critical part of their business decision process.
Conclusion
If you are looking for a visualization tool to build dashboards from a wide variety of data sources, we can’t think of a better option than Grafana. It’s an important part of Lineate’s monitoring stack.
Share:
Got a project?
Harness the power of your data with the help of our tailored data-centric expertise.
Contact us